
“Our channel performance is 20% higher, isn’t that great!”
“Ehh, not when all the other channels are up 40%.”
Gathering data is important, but numbers don’t tell you that much when you have no context. Benchmarking is the practice of looking at your data alongside comparable data to get an idea of what your numbers really mean. But how can you make sure that the numbers you’re comparing your data with are representing trends and performance accurately?
What’s benchmark data, and why does it matter?
Benchmark data is data you can use to determine how an element of your business is truly performing. Whether it’s ad cost, actions per advertisement, or streaming numbers, benchmark data is the “standardized” data you use to make decisions about your strategy. And it’s super important. When you’re trying to measure your information against competitor data, forecasts, and budgets, accurate benchmarks are crucial for making informed and effective choices.
How can benchmark data affect decision making?
As an example, let’s look at Facebook ad Cost-Per-Click (CPC). To determine how much to spend on Facebook ads, you’d want to get an expectation for what CPC should be. There are simple Facebook CPC average graphs readily available online:
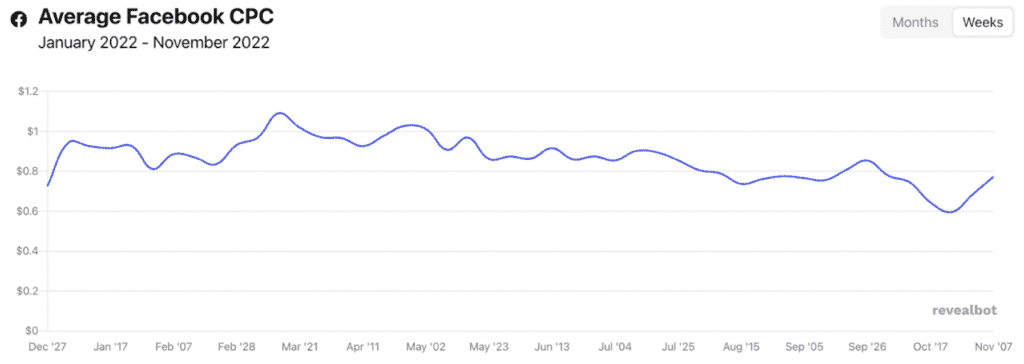
When we look at this graph, we get a straightforward, one-dimensional story – Facebook CPC has mostly stayed between $0.70 and $0.90 USD, with a bump in March and a dip in October. The price seems fairly consistent, and there’s just not that much information.
However, CPC is impacted by all sorts of invisible elements that an average doesn’t take into account. For instance, situational factors like day of the week, seasons, and recent ad performance can all affect CPC. Without taking those factors into consideration, it’s impossible to get an accurate picture of CPC.
When we look at a Pickaxe graph that includes these elements, we get a much more detailed picture:
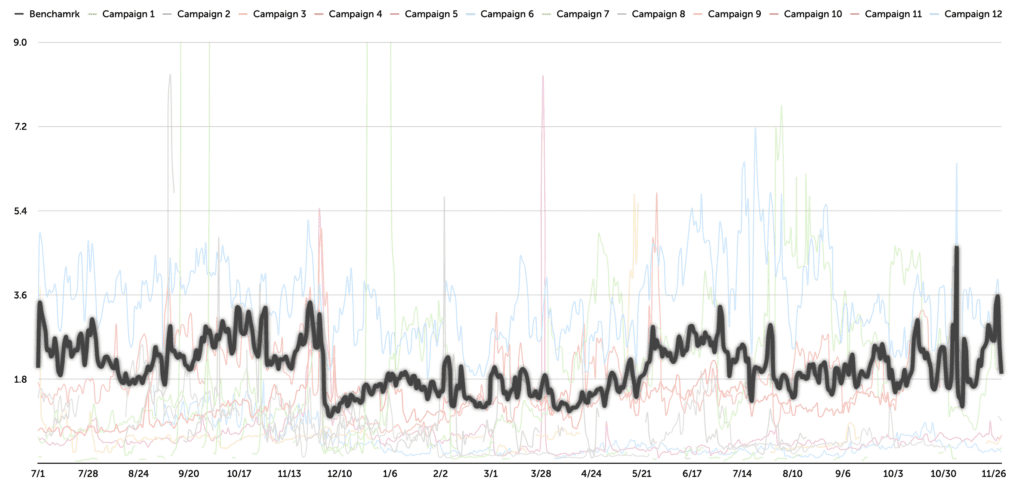
Each colored line represents a different data set – when we look at them all together, we can see that CPC varies far more than the average graph implies. Each set belongs to an organization that is affected by different situational factors, that is implementing different strategies. By putting together a composite (represented by the black line), we can get a much clearer idea of trends in CPC over time.